This blog was contributed by Dr. Mark Sullivan, Technical and Application Specialist at BUCHI Corporation.
The head of a well-known agricultural testing laboratory recently approached me with an unusual request. This laboratory performs 10’s of thousands of plant tissue analyses annually using the Dumas combustion technique for total nitrogen and carbon (AOAC Official Method 972.43). He was making plans to increase his testing capacity and had begun to investigate unconventional alternatives that might offer higher throughput and ultimately lower cost per analysis.
He knew that NIR had a reputation as a fast technique and was curious to know what kind of throughput our automated NIR instrument would provide. I explained that a typical analysis time to measure multiple properties in a plant sample was approximately 30 seconds. His quick response was that this was a significant improvement over combustion analysis which required about 4 minutes per sample. Allowing a margin for unknown variables he then conservatively estimated that purchasing a single NIR would yield sample throughput equivalent to 4 combustion analyzers. This was an extremely attractive proposition even before considering the cost of operation.
For my part I knew that NIR had the clear throughput advantage. What I did not know was how accurately it could predict total nitrogen and carbon percentages in comparison to combustion analysis. After all, NIR is a molecular spectroscopy technique that is used to measure protein, moisture and fat in agricultural samples, not elemental composition. As it turned out, it didn’t take long to answer this question once the samples arrived.
While it might seem more challenging to be scrutinized by a customer steeped in analytical instrumentation than a typical food and feed customer, in fact, it is an advantage. I received 53 samples of plant leaves that were carefully prepared for combustion analysis (dried and ground). The combustion reference values that were provided covered a wide range of nitrogen and carbon contents. The sample quantity was limited to 1-2g which was ideal for small vials and allowed me to use the 6 position auto sampler accessory rather than the single sample cups.
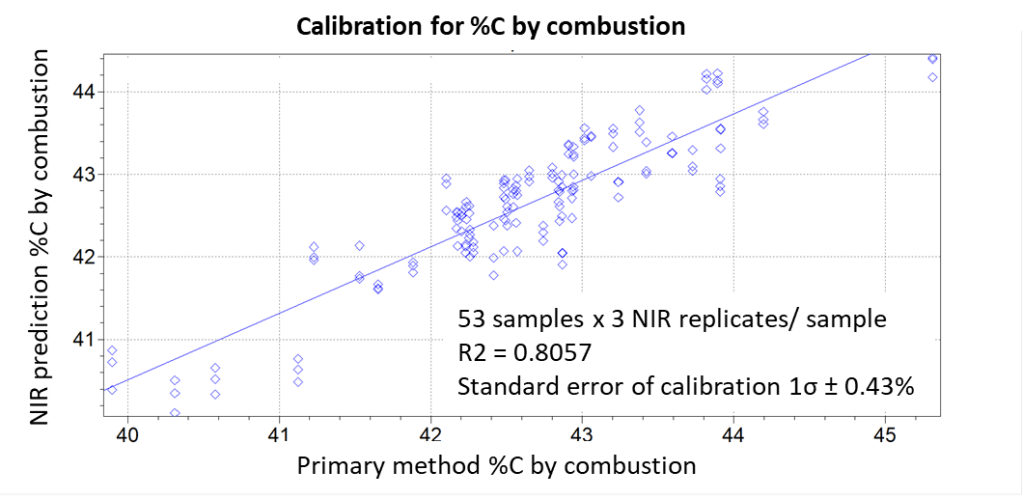
The results of the initial calibrations for nitrogen and carbon are shown in Figures 1 and 2, respectively. All samples were measured in triplicate by shaking the contents of the vial between replicates. This is commonly done during the calibration phase to include the effect of variable packing density, but is not required for routine testing. The linearity expressed as R2 and standard error of calibration were somewhat better for %N than for %C, however, because the absolute amount of carbon was about 10 times higher than for nitrogen the standard error was quite acceptable. NIR is, of course, a secondary technique and, as such, will typically have a standard error of 1.5-2 times that of the primary combustion method. While high accuracy is desirable, the NIR results clearly show whether crops exhibit elemental values inside or outside of the normal range. Because the sample is not modified or destroyed by the NIR measurement, it is still available for combustion analysis if further accuracy is needed before adjusting crop nutrition.

Now let’s get back to the economic calculations. The NIR analysis time was adjusted to match the amount of time that it takes to fill 6 vials for the autosampler, approximately 2 minutes. I know what you are thinking: How can you weigh out 6 samples accurately in two minutes? The answer is that NIR measures concentration, not total gram weight; therefore, the sample weight is not needed. Rather, the sample vial just needs to be filled to a minimal depth. With a dedicated operator it is essentially a semi-automated continuous process with throughput of 180 samples/hour. The combustion analyzer with an autoloader can process about 15 samples/hour unattended. The cost of consumables for combustion analysis is roughly $1/sample vs no consumables cost for NIR, translating to an immediate savings of $20k for a lab processing 20 thousand samples/year.
In terms of on-going costs, the NIR instrument requires preventive maintenance only on an annual basis to replace the lamp and filters. The combustion analyzer requires substantial maintenance requiring significant downtime for cleaning and to replenish consumables.
If NIR is so great for nitrogen and carbon analysis, you might be wondering: why isn’t everyone using it instead of combustion? NIR methods are super-efficient when you are analyzing high volumes of the same type of samples routinely. It’s not efficient to develop NIR calibrations when your samples are constantly changing and are dramatically different. Similar plants, like grasses, may share a common NIR calibration. Other plant varieties may require their own calibrations to obtain optimum results (i.e., low error). You’ll want to fall back on your combustion methods when you’re not seeing similar samples come in routinely, or for those “unusual” samples that you don’t come across often. It’s also an expectation that you’d regularly validate NIR performance using a primary method, whether done in-house or by a 3rd party.
The take home message is if you already have combustion analysis and want to increase throughput for nitrogen and carbon analysis, NIR is a lower cost alternative which requires minimal maintenance and is easy to operate.
