The focus of this post is NIR project and sample planning, a critical step in the NIR method development process that often gets rushed through in the eagerness to have our NIR instruments pump out measurement results. Putting some extra effort into sample planning could pay off big dividends in terms of two things I suspect are really important to you – accuracy and robustness. So, let’s get into it.
Let’s start our discussion by framing it in an example. You work at The Cheese Factory, and you want to measure the fat content in your cheese using NIR.
Fat is incredibly important to you for a few reasons. For one, fat is the vehicle for the flavors of your cheese and creates a creamy mouth feel. If you don’t have enough fat, your cheese will be hard and corky. No one wants corky cheese. However, fat isn’t cheap, so you don’t want any more in there than you need—that’s money down the drain. The formulation people have been tasked to establish what amount of fat is “Just Right” but you need to make sure that’s what comes off the conveyor belt.
What do you do?
Defining a property range
Your first thought might be to grab a few samples of cheese that span a range of fat content, each with reference measurements confirmed by your primary method. That’s a good start. There are some general recommendations that you should consider when it comes to the range of the property you want to calibrate for. Whether it’s fat in cheese or an active ingredient in a pharmaceutical formulation, first consider the primary method you’re using as a reference for the property. That method has a standard error associated with it. Take 20x that error and that is the minimal range over which your calibration property values should span to reduce the impact of the reference error on your NIR model.
Whatever property range you might expect to see as a reflection of normal process variation is what we can your working range. The calibration range should be broader than the working range to avoid extrapolation; that is, avoiding measurement predictions outside of the scope of the calibration.
When possible, the target value (e.g. label claim) of your property should fall in the middle of the calibration range, and all of your concentration points would be more or less evenly distributed across the calibration range. At the very least, avoid a situation where you have one large cluster of points at one end of the range and only a few points at the opposite end.
As an example:
- Target (Label Claim) = 50% Property (e.g. “Fat”)
- Standard Error of Lab (SEL) = 1% Property
- Calibration Range, Suggested = SEL x 20 = 1% x 20 = 20%
- Calibration Range, Min. = Target – (Calibration Range/2) = 50 – 20/2 = 40% Property
- Calibration Range, Max. = Target + (Calibration Range/2) = 50 + 20/2 = 60% Property
Accounting for production variation
Keep in mind, even though your primary objective is to build a calibration model for fat in cheese, there is other “stuff” in there that is going to absorb or scatter NIR light, impacting the spectra you collect (e.g. giving it “extra” peaks and valleys or offsetting baselines). And if it impacts the spectra you collect, it could impact the accuracy or precision of your fat measurement by NIR.
In this example, let’s consider other components in the cheese formulation: Moisture, protein, lactose, and salt. Sample temperature, consistency, and the mode of sample preparation can also impact the spectra we collect.
So, in total, this example is suggesting that there are 7 additional factors to consider outside of FAT when developing an NIR calibration for fat in cheese. Let’s take a look at an example method planning worksheet to see how we can accommodate known product variations into our NIR model.
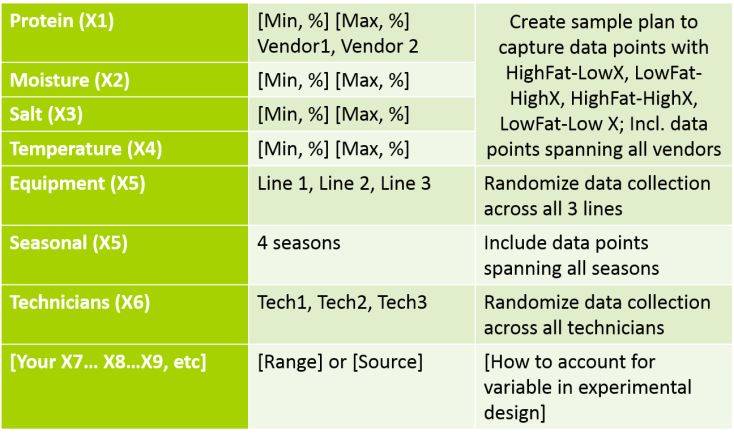
This is one tool you might consider when you are looking to start a new NIR project or optimize a current project. I highly recommend applying this type of table to your method planning. Let’s start with our example of fat in cheese. The first thing to record is your formulation target as input A. This number is based on your label claim and determined by formulation scientists. Next, record your current reference method for that property. Here, we might have an extraction. This method should be kept constant throughout the NIR method development cycle, as different laboratory methods have different accuracy and precision relative to one another. Input C should reflect the standard error of the laboratory for whatever reference method you select. Take 20 times that number to get your recommended range for that property, as shown in the previous slide.
The working range, input D, is your typical property variation. Regardless of the calibration range recommendation, your working range needs to be within the boundaries of the calibration method.
The sample prep and presentation should be well-defined and kept constant. There may be some trial and error here at the beginning of your project, depending on limitations of practicality and desired calibration performance. In general, the more uniform the sample is, the better the method precision.
The last column shown here is a catch-all for all other known sources of chemical and/or physical property variation expected in your sample.
Let’s dig a little bit deeper into the product variations that should be captured within the sample plan, as shown in the Table below:

Write out the min and max values for each component in the matrix and be intentional with identifying samples that span the full range of possibilities. As indicated here, each ingredient or component of a sample has a minimal and maximal value associated with it. Perhaps there are also various vendors supplying these components and vendors have slightly different particle size specifications that can impact our NIR signal. For optimal method robustness, be sure to collect calibration samples that have been produced with materials sourced from multiple vendors to account for any chemical or physical property differences in those materials.
If your production involves heating or cooling, you’ll need to either (a) standardize the temperature at which NIR spectra are collected or (b) build the temperature variation into your model. For the latter, I would suggest collecting spectra of a single sample at multiple temperatures. For actively cooling samples, collect the first spectra when the sample is hot, then collect spectra of the block after it’s reached room temperature.
If your plant has several different production lines, it would be a good idea to collect samples that were produced from each process line, as equipment aging or servicing may impact things like finished product particle size, morphology, or packing density.
If your product is very hygroscopic it is likely to be more sensitive to seasonal variations in temperature and humidity, so calibration data collection across seasons may be required in order to optimize model robustness. If your sample is very compressible, it is likely to be more sensitive to sample handling and so exhibit greater operator-to-operator variation during sample prep. I use the example of Boris the Strong-Man tapping a powder sample into a vial and the powder forms a near-solid puck. Then there is Gentle Jim, who gently taps the vial so that the powder flows to the bottom of the vial. Boris and Jim’s samples have very different packing densities which will show up as baseline offsets in the spectra, so randomizing calibration data collection across several operators is good practice.
As you consider your own project, be sure to include any additional sources of variation. Talk to plant operators and plant managers or formulation chemists to uncover variables that may be impacting your method performance.
Also keep in mind that method precision is likely to be better when factors outside of your property of interest, such as sample temperature, are held constant (or as constant as is practical) rather than varied.
Sample uniformity and dynamics
Other critical sample characteristics that often get overlooked during the method development process are sample consistency and stability.
Consider the physical state of your samples. Does it phase separate, forming oily or watery layers? Is moisture easily driven off or absorbed? If so, it’s important to create standard operating procedures to limit the impact of those sample characteristics on your method performance. Something as simple as adding a stirring step to a hot or oily sample (to homogenize the sample) could pay huge dividends with regard to method performance.
We also want to keep in mind how well the sample sent for reference testing matches the sample analyzed by the NIR. Ideally, we would take advantage of the non-destructive testing of the NIR and use the actual NIR sample for the reference laboratory testing. Even if you’re able to do that, the sample size for each method may differ, and the following points should be considered to obtain our goal, which is that the reference laboratory sample is representative of the NIR sample:
Below, I have 5 illustrations representing different sampling situations. Solid blue represents the sample matrix, yellow circles represent our property of interest, and the light blue drops represent moisture. The solid black box indicates the sample volume by NIR, while the red hashed box represents the sample submitted for reference testing.
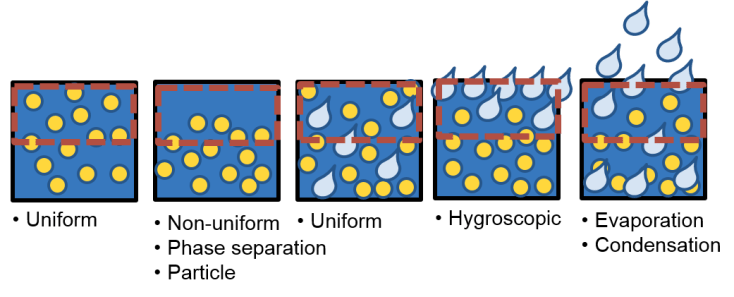
In the leftmost box, the sample is uniform throughout. The sample submitted for reference testing matches the sample for NIR. There is no problem here and the precision of both methods should be very good.
In the second box, the sample is non-uniform. Our property of interest is accumulating at the bottom of the sample cup, maybe due to phase separation or particle segregation. If the reference sample is drawn off the top, the results will not represent the NIR sample measurement well. The precision of our method will be poor unless some sort of mixing or homogenizing step is added.
In the third box, we introduce moisture as an added variable. Here again, moisture is evenly distributed in the sample and there is no issue with reference and NIR data correlation.
In the fourth box, we have a hygroscopic material that readily absorbs moisture from the environment. If the reference sample is taken from the top it will be biased toward higher water content than is representative of the sample as a whole. The sample requires stirring prior to removal of the sample for the reference method as well as prior to measurement by NIR.
The final box illustrates the non-uniformity of moisture. This could be a hot block of cheese coming off the conveyor belt or a powder pulled from a fluid bed dryer. If water is actively being evaporated or you see water pooling on the surface, you risk biasing your moisture data by simply collecting a sample from the top of your product. In this case, it may be useful to wait until the sample has reached a steady-state temperature and/or mixing the sample bed (e.g. for powders) before analyzing by either the reference or NIR methods, respectively.
Sample collection
After going through these slides with your own products in mind, you may have identified all of the product variations you anticipate in routine production. You are starting to formulate a plan to ensure that the sample submitted for reference testing is representative of your NIR sample. The next question is… where are these samples coming from?
The first answer is: from production. However, your routine production is likely to have pretty tight control and you’re building the NIR model to look for rare process deviations. You might be able to get some more extreme values of property range or other factors like particle size by pulling samples close to process start-up or run-off.
In many cases, it is not very efficient to wait for out-of-spec samples from production. If your production process is small-scale, you may consider intentionally creating out-of-spec materials using your actual production equipment. For example, creating high-fat cheese by adding an excess of butterfat to one batch or by intentionally over-drying a granulation run. In other situations, you may find it more economic and efficient to perform “spiking” or dilution steps to your products to produce adequate property ranges.
How many samples are required to build a robust NIR method? The simple answer is… it depends. Typically, the more complex the sample matrix and the more sources of variation you’ve identified using the prior tables, the more samples are needed. Generally, a start-up model may require 50 unique samples. There are plenty of exceptions to this rule. For example, if you’re quantifying something with a very unique NIR peak you may be able to get away with fewer samples. If your sample matrix has a lot of ingredients with spectral overlap, as typically seen with foodstuffs, you may need more than 100 samples.
Calibration in itself should be considered a continuous process. You can be reactive or proactive in extending that calibration to improve robustness to unforeseen or un-modeled sources of variation.
Sample failure, calibration update
Samples failing your NIR method may indicate that calibration update is necessary! But, not every time. So, how do you know a measurement has failed, and what does that failure mean?
The NIRWare Operator software makes it fairly easy to identify which samples should be used to update an existing calibration model – see the samples with the red X! There are two types of outliers that the Operator software will flag: spectral residuals and property outliers.
When you have a spectral residual outlier, the Operator will not obtain an NIR measurement result, only a visible red X. Spectral residuals indicate that the sample that was just measured had spectral features – that is, the peaks and valleys – that did not match up with the calibration data set. This could be the result of the original calibration being over-fit, leading to very tight tolerances, or it could be that the sample that was just measured has property combinations (like high fat, low moisture) that were not part of the calibration. Worse case is that a spectral residual is due to a contaminant that was not present in the calibration data set.
A property outlier indicates that the current sample has a property value prediction that is outside of the calibration range. This is considered an extrapolation.
However, the “failed” result may also be an issue with the way the sample was collected! In order to verify that you truly have a calibration outlier, please run through the following check-list.
- Check that sample (or probe) is positioned properly during the measurement
- Check that the optical path (window, sample container) is clean and retry measurement
- Check that a good reference was collected and that reference material is clean
- Sample may have new variation that wasn’t used in the calibration training set (e.g., higher moisture content due to seasonal humidity, new vendor with different particle size)
If all signs are pointing to the sample truly being unique (i.e. out-of-specification and out of the range of the calibration model), then send this sample for primary analysis, add to the calibration data set and recalculate the model.
Identification of spectral outliers or range extrapolations is one way to plan for samples for calibration model update! This is a reactive approach but reasonable.
To be more proactive when time and resources allow, you can look for gaps in your current design space. Take a look at your reference vs. predicted plot to see if you are adequately covering the calibration range with samples or if gaps exist. Create scatter plots of the calibration properties (e.g. Property 1 vs. Property/Variable 2) to identify gaps in the design space when multiple variables are considered. Once holes are identified, flag samples that match your missing criteria in routine production, or manually create those samples using small batch processing, spiking, or dilution experiments, when possible.

I hope this was helpful in planning (or updating) your quantitative NIR methods. Be sure to check out our other FT-NIR user Best Practice Blogs for qualitative method development and quantitative methods for pre-calibration users. Should you have additional specific topics that you would like to see covered in this blog, please submit your ideas!

Leave a comment